Multivariate Statistical Analysis I (VL+UE)
哈德勒教授和西马教授的《应用多元统计分析》教材的最大特色在于统计理论和应用的完美结合,书中提供了大量金融和经济等领域的案例来形象地说明相关的统计计量理论,而且读者可以下载相应的MATLAB或R语言程序来再现书中所有的例题和图形,这对于读者快速地理解和在实践中灵活地运用高维数据统计分析方法是十分有帮助的.
—— 范剑青 美国普林斯顿大学讲座教授 中国科学院特聘教授
Description
Most of the observable phenomena in the empirical sciences are of a multivariate nature. In financial studies, assets in the stock markets are observed simultaneously and their joint development is analyzed to better understand general tendencies and to track indices. In medicine recorded observations of subjects in different locations are the basis of reliable diagnoses and medication. In quantitative marketing consumer preferences are collected in order to construct models of consumer behavior. The underlying theoretical structure of these and many other quantitative studies of applied sciences is multivariate. The course of Multivariate Statistical Analysis (MVA) describes a collection of procedures which involve observation and analysis of more than one statistical variable at a time.
The registration in the respective Moodle course is obligatory.
Contents
In the first part of Multivariate Statistical Analysis (MVA I) following topics are treated: descriptive techniques, matrix algebra, regression analysis, simple analysis of variance, multivariate distributions, theory of the multinormal, theory of estimation, hypothesis testing, decomposition of data matrices by factors, principal components analysis. In the second part (MVA II) further themes are covered: factor analysis, cluster analysis, discriminant analysis, correspondence analysis, canonical correlation analysis, multidimensional scaling, conjoint measurement analysis, applications in finance, highly interactive, computationally intensive techniques.
Course Outline
Multivariate statistical analysis (MVA) describes a collection of procedures which involve observation and analysis of more than one statistical variable at a time. There are many different models which are covered in MVA I, each with its own type of analysis:
- Descriptive Statistics and Tests are important tools to make conclusions about the sample and the population. Descriptive measures and known test will be repeated and new descriptive measures and tests will be introduced. A case study will be presented.
-
Regression analysis attempts to determine a linear formula that can describe how some variables respond to changes in others. Linear regression is a method for determining the parameters of a linear system, that is a system that can be expressed as follows:
 .
.
In MVA course a case of multiple linear regression is studied, when there are more than one explanatory variable.
-
Multivariate normal distribution, also sometimes called a multivariate Gaussian distribution, is a specific probability distribution, which is a generalization to higher dimensions of the one-dimensional normal distribution:
The importance of the normal distribution as a model of quantitative phenomena in the natural and behavioral sciences is due to the central limit theorem (the proof of which requires advanced undergraduate mathematics). Many psychological measurements and physical phenomena (like photon counts and noise) can be approximated well by the normal distribution. While the mechanisms underlying these phenomena are often unknown, the use of the normal model can be theoretically justified by assuming that many small, independent effects are additively contributing to each observation. .
.

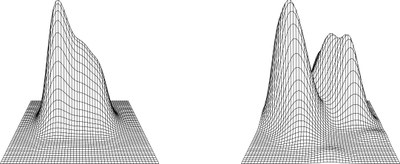
Figure: Univariate (left) and joint (right) density estimate for Bank notes dataset. - Theory of estimation develops the basic theoretical tools which are needed to derive estimators and to determine their properties in general situations. This part of course basically relies on the maximum likelihood theory. In many situations, the maximum likelihood estimators indeed share asymptotic optimal properties which make their use easy and appealing. The multivariate normal population and the linear regression model will be presented, where the applications are numerous and derivations are easy to do. In multivariate setups, the maximum likelihood estimator is at times too complicated to be derived analytically. In such cases, the estimators are obtained using numerical methods (nonlinear optimization). The general theory and the asymptotic properties of these estimators remain simple and valid.
- Hypothesis testing combines statistical tools which allow to test the hypothesis that the unknown parameter belongs to some subspace. A rejection region can be constructed based on likelihood ratio principle. This technique will be illustrated through various testing problems and examples such as comparison of several means, repeated measurements and profile analysis.
- Decomposition of data matrices by factors uses geometrical approach as a way of reducing the dimension of a data matrix. The result is a low dimensional graphs of the data matrix. This involves the decomposition of the data matrix into "factors", which can be sorted in decreasing order of importance. In practice the matrix to be decomposed will be some transformation of the original data matrix and these transformations provide easier interpretations of the obtained graphs in lower dimensional spaces. This approach is very general and is a core idea of many multivariate techniques.
- Principal components analysis attempts to determine a smaller set of synthetic variables that could explain the original set. PCA is an orthogonal linear transformation that transforms the data to a new coordinate system such that the greatest variance by any projection of the data comes to lie on the first coordinate (called the first principal component), the second greatest variance on the second coordinate, and so on. PCA can be used for dimensionality reduction in a data set while retaining those characteristics of the data set that contribute most to its variance, by keeping lower-order principal components and ignoring higher-order ones.
Literature and Sources
- Härdle W.K., Hlavka Z. (2015, 2nd ed.) Multivariate Statistics: Exercises and Solutions, Springer Verlag, DOI:10.1007/978-3-642-36005-3.
- Härdle W. K., Simar L. (2015, 4th ed.) Applied Multivariate Statistical Analysis, Springer Verlag, DOI:10.1007/978-3-662-45171-7.
- Johnson R., Wichern D. W. (2008, 6th ed.) Applied Multivariate Statistical Analysis, Pearson.
-
 www.quantlet.de (source codes)
